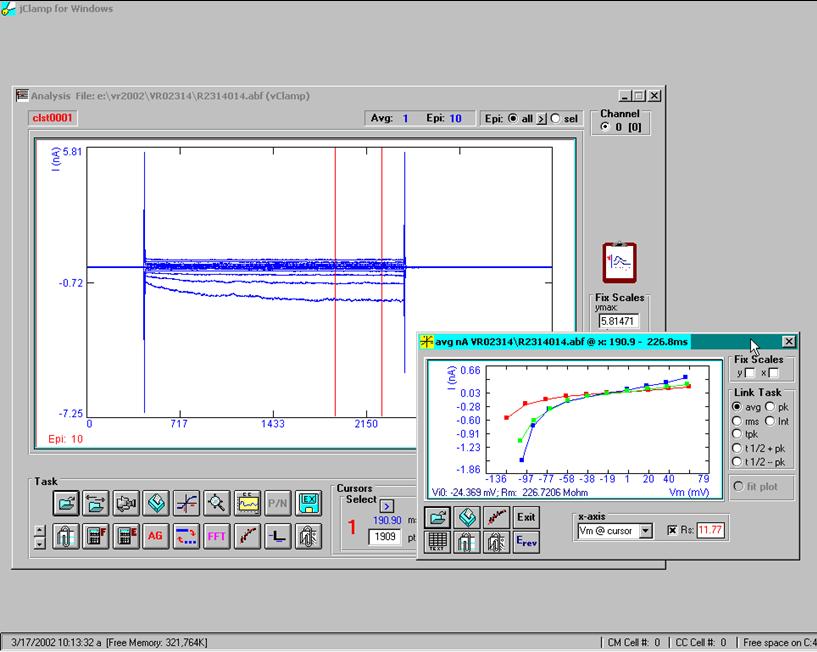
IV Plot
Select iv plot button to plot a range of values (avg, rms, peak, integral, time to peak, time to positive ½ peak, time to negative 1/2/ peak) versus episode or voltage at particular partitions. If Rs check box is checked then the voltages are corrected for series resistance obtained from CC or entered manually. The open file button in the iv plot window will allow selection of multiple files of similar protocols to compare plots. Order of plots are RGB then dark RGB, then all red. The text button will show all the x,y data that can be copied to the clipboard and pasted into any other program. For i-v plots, the reversal potential and resistance at zero volts are calculated for each data set plotted. Pressing the Erev button will copy the results to the clipboard.